
The workflow in one line: on a schedule, the automation pulls the numbers that matter from every tool you use, assembles them into a clean digest, and delivers it to your team or inbox — turning the manual weekly reporting slog into a task nobody has to do. Reporting is one of the most common time-sinks in a business: someone logs into five tools, copies numbers into a spreadsheet, and formats a summary, every week. This workflow does all of that automatically, so everyone sees the numbers and no one builds the report. Here's the exact build.
The problem it solves
Reporting eats a surprising amount of time and it's almost entirely mechanical: log into the CRM, the ad platform, the analytics tool, and the accounting system; copy the key figures; paste them into a spreadsheet; format; and send. It's an hour or more, every week or month, of pure busywork — and because it's tedious, it often gets skipped or done inconsistently, which means the team is flying without current numbers exactly when they need them most. The information exists in your tools; the friction is purely in assembling it. Reporting runs on a scheduled trigger rather than an event-driven one — that distinction, and the rest of the vocabulary this teardown assumes, is covered in what workflow automation is and how to scope a first build.
This workflow removes that friction completely. It knows where each number lives, pulls them on schedule, does any calculations (growth, totals, comparisons to last period), formats them into a readable digest, and delivers it — to Slack, email, or a dashboard — without a human touching it. The report that used to be a chore becomes a reliable heartbeat: the same clear numbers, on time, every period, so decisions are made on current data and nobody spends their morning building a spreadsheet.
The build, node by node
Here's the exact workflow. It's a handful of nodes, runs for pennies on a per-run engine like n8n, and connects whatever tools you already use:
| Step | What it does |
|---|---|
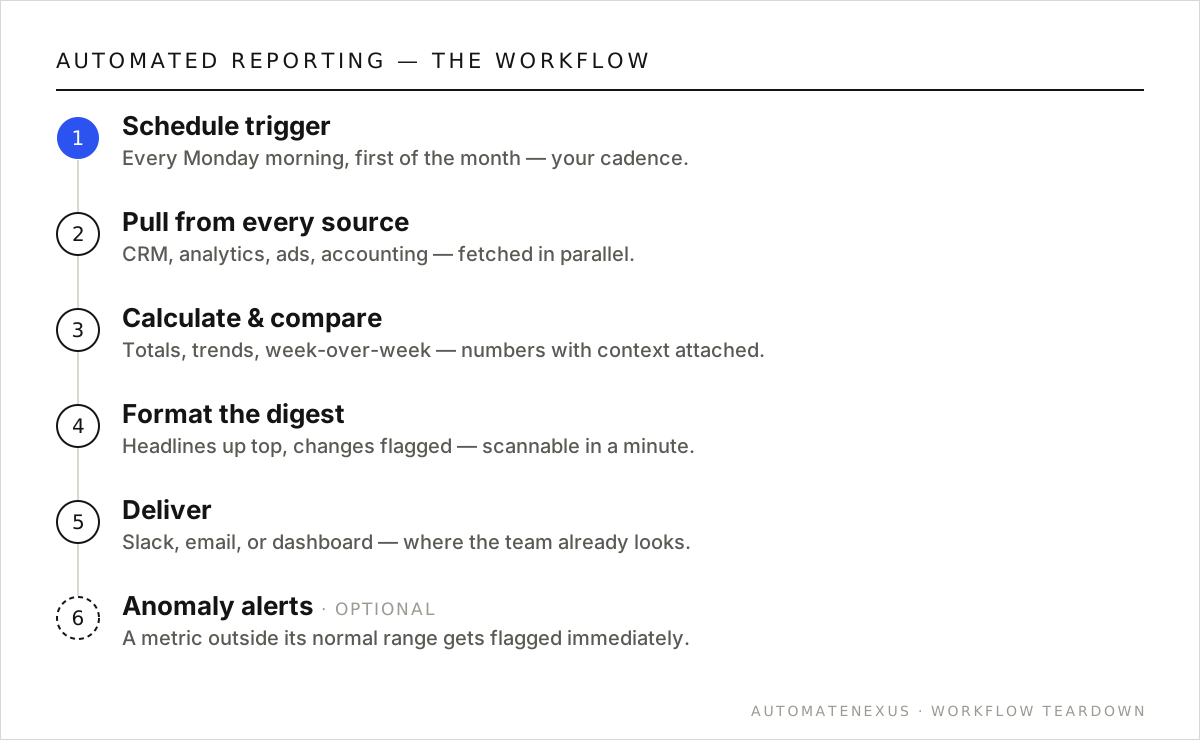
| 1. Schedule trigger | A Schedule node runs the workflow on your cadence — every Monday morning, the first of the month, whatever fits. Time-driven, no webhook. |
| 2. Pull from each source | Parallel calls fetch the metrics from each tool — CRM (pipeline, deals), analytics (traffic, conversions), ads (spend, leads), accounting (revenue) — via each tool's node or the HTTP Request node. |
| 3. Calculate & compare | A Set/Code node computes the derived numbers: totals, week-over-week or month-over-month change, and any KPIs you care about. Raw numbers become insight. |
| 4. Format the digest | Assemble a clean, scannable summary — the headline metrics up top, changes flagged (up/down), and any notable movements called out. Keep it short enough that people actually read it. |
| 5. Deliver | Send it where the team lives — a Slack channel, an email to leadership, or push it to a shared dashboard. Meet people where they already look. |
| 6. (Optional) Alert on anomalies | Add IF checks that flag when a metric moves outside its normal range — a spike in ad spend, a drop in conversions — so the digest doubles as an early-warning system. |
Variations worth building
- Role-specific digests: sales gets pipeline metrics, marketing gets funnel metrics, the owner gets the P&L view — same engine, different slices to different people.
- AI-written summary: an AI step turns the raw numbers into a short plain-English narrative ('leads up 12% on stronger paid performance; watch the dip in reply rate'), not just a table.
- Cadence tiers: a daily quick-pulse digest plus a deeper weekly and monthly view, all from the same data sources.
- Dashboard sync: instead of (or alongside) a message, write the numbers to a live dashboard your team can check anytime.
Common mistakes to avoid
- Reporting everything — a digest with fifty numbers gets ignored. Pick the handful that actually drive decisions and lead with those.
- No comparison — a number without context ('revenue: $40k') is far less useful than one with it ('revenue: $40k, up 12% vs last week'). Always compute the change.
- Sending it where no one looks — an email report that goes to an unread inbox is wasted. Deliver to where the team already is (usually Slack).
- Fragile source calls — if one tool's API blips, the whole digest can fail. Wrap calls in retries and handle a missing source gracefully so the report still sends.
The payoff, quantified
The direct saving is obvious — the hours someone spends every week assembling reports are returned to higher-value work — but the bigger payoff is the quality of decisions. When accurate numbers arrive reliably and on time, a team makes decisions on current reality instead of stale spreadsheets or gut feel. Catching a dip in conversions or a spike in ad spend a week earlier, because the digest surfaced it automatically, can be worth far more than the reporting time saved. Good, timely information is the input to every good decision, and this workflow guarantees it.
There's also a consistency dividend. Manual reports get skipped when people are busy — which is exactly when the business most needs visibility. An automated digest never skips, never has an off week, and presents the same metrics the same way every period, so trends are actually comparable over time. That reliability turns reporting from a chore that happens sporadically into a dependable heartbeat the whole team can plan around — and it costs almost nothing to run once built.
Do I need a data analyst to set this up?
No — the workflow pulls from your existing tools' APIs and formats the output, which an automation builder handles without a dedicated analyst. The judgment part is deciding which metrics matter and how to present them, which you know better than anyone. Once it's built, it runs itself. For complex analytics you might involve a specialist, but a solid recurring digest of your key numbers doesn't require one.
Can different people get different reports from the same setup?
Yes, and that's a major efficiency: one engine pulling the data can slice and send role-specific digests — pipeline metrics to sales, funnel metrics to marketing, the financial view to leadership — each formatted for its audience. You build the data-gathering once and route tailored views to everyone who needs them, rather than building a separate report per person.
FAQ
What tools can an automated report pull from?
Any tool with an API — which is nearly all modern business software: CRMs, analytics platforms, ad networks, accounting systems, help desks, and more. n8n connects via dedicated nodes or the HTTP Request node, so the digest can combine numbers from every corner of your stack into one place, which is often impossible to see otherwise without logging into each tool separately.
How often should reports be automated?
Match the cadence to how you make decisions: a weekly digest suits most teams, with a monthly deeper view for leadership, and a daily quick-pulse if you're actively optimizing something. Because it's automated, adding more frequencies costs almost nothing — the same engine can send a daily, weekly, and monthly view to different audiences.
Can the report include a written summary, not just numbers?
Yes — an AI step can turn the raw metrics into a short plain-English narrative that highlights what changed and why it might matter, so readers get insight, not just a table. This makes the digest far more useful for busy leaders who want the 'so what' without interpreting numbers themselves.
What happens if one data source is down when the report runs?
With proper error handling, the workflow degrades gracefully — it retries the failed call, and if a source is genuinely unavailable, it can send the report with that section flagged rather than failing entirely. Building in retries and a fallback (see our n8n error handling guide) keeps your reporting reliable even when a tool has a bad day.
Build it yourself, or have it built
This reporting digest workflow is genuinely buildable yourself if you're comfortable in a no-code automation tool. The structure above is the whole blueprint — the work is connecting each step to your specific accounts and testing the edge cases (what happens with bad data, a failed API call, an unusual input). If you enjoy that and have the time, start with our how-to-automate guide and the n8n webhooks guide, build it on self-hosted n8n so you own it, and you'll have a working automation for the price of a small server.
If you'd rather it just work — built correctly, with the error handling and edge cases handled, wired into your exact stack, and owned by you outright — that's precisely what we do. We build these workflows as one-time projects on infrastructure you keep, so there's no monthly platform fee and no vendor lock-in: you get the system and the keys. Either way, the important thing is to build it — a reporting digest process running automatically, reliably, and consistently is worth far more than the same work done by hand when someone remembers. Ship it, measure the impact, and let the payback fund the next automation on your list.
Want your numbers to assemble themselves? A free audit maps the digest to your exact stack. Related: invoice chasing and 10 n8n templates.